

|
|

|
| | | | | | | | | | Welcome! Login |
Data Set Group2: GE-NIAAA Cerebellum mRNA M430v2 (May05)
|

|
|
| Specifics of this Data Set: |
| None |
| Summary: |
|
| About the cases used to generate this set of data: |
| We use a set of BXD recombinant inbred strains and standard inbred strains. The BXD lines are derived crossed between C57BL/6J (B6 or B) and DBA/2J (D2 or D). Both B and D parental strains have been almost fully sequenced (8x coverage for B6 by a public consortium and approximately 1.5x coverage for D by Celera Discovery Systems) and data for 1.75 millioin B vs D SNPs are incorporated into WebQTL's genetic maps for the BXDs. BXD2 through BXD32 were produced by Benjamin A. Taylor starting in the late 1970s. BXD33 through 42 were also produced by Taylor, but they were generated in the 1990s. These strains are all available from The Jackson Laboratory, Bar Harbor, Maine. BXD43 through BXD99 were produced by Lu Lu, Jeremy Peirce, Lee M. Silver, and Robert W. Williams in the late 1990s and early 2000s using advanced intercross progeny (Peirce et al. 2004). Most BXD animals were generated in-house at the University of Tennessee Health Science Center by Lu Lu and Robert Williams using stock obtained from The Jackson Laboratory between 1999 and 2004. All BXD strains with numbers above 42 are new advanced intecross type BXDs (Peirce et al. 2004) that are current available from UTHSC. Additional cases were provided by Glenn Rosen, John Mountz, and Hui-Chen Hsu. These cases were bred either at The Jackson Laboratory (GR) or at the University of Alabama (JM and HCH). |
| About the tissue used to generate this set of data: |
| The May 2005 data set consists of a total of 61 array (Affymetrix 430 2.0 arrays) from 40 different genotypes. Each sample consists of whole cerebellum taken from three adult animals of the same age and sex. The M430 2.0 arrays were processed in several batches. Replication and Sample Balance: We obtained data independent biological sample pools from both sexes for half of the strain, including most of the standard inbred strains (129S1/SvImJ is the exception and is represented by two female-only arrays). Most BXD strains are represented by single pooled samples. You can determine the sex of a sample from the table below or by reviewing the expression of the Ddx3y and Xist RNA signal.
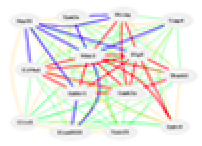
Legend: Sex balance of the GE-NIAAA data set can be easily evaluated by analysis of this scatterplot of Ddx3y and Xist. Ddx3y (also called Dby) is a transcript with high expression in males whereas Xist is a transcript with high expression in females. Strains that fall in the upper left quadrant are represented only by a single female sample (except in the case of the 129S1/SvImJ data) whereas strains that fall in the lower right quadrant are represented only a a single male sample. RNA was extracted at Genome Explorations. All samples were subsequently processed at the Genome Explorations Inc. by Divyen Patel and colleagues. |
| About the array platform: |
| Affymetrix Mouse Genome 430 2.0: The 430 2.0 array consist of approximately 992936 25-nucleotide probes that collectively estimate the expression of approximately 39,000 transcripts. The array sequences were selected late in 2002 using Unigene Build 107. The arrays nominally contain the same probe sequences as the 430A and 430B series. However, we have found that roughy 75000 probes differ from those on A and B arrays and those on the 430 2.0 |
| About data values and data processing: |
Probe (cell) level data from the CEL file: These CEL values produced by GCOS are 75% quantiles from a set of 91 pixel values per cell. About the chromosome and megabase position values: The chromosomal locations of probe sets included on the microarrays were determined by BLAT analysis using the Mouse Genome Sequencing Consortium March 2005 Assembly (see http://genome.ucsc.edu/cgi-bin/hgBlat?command=start&org=mouse). We thank Dr. Yan Cui (UTHSC) for allowing us to use his Linux cluster to perform this analysis. |
| Notes: |
| This text file originally generated by RWW and YHQ, March 21, 2005. Updated by RWW, March 23, 2005; RWW April 8. |
| Experiment Type: |
| |
| Contributor: |
| |
| Citation: |
| |
| Data source acknowledgment: |
Data were generated with funds to Genome Explorations, Inc., for the NIAAA as part of an SBIR grant to Dr. Divyen Patel. Mouse colony resources and integration of data into GeneNetwork was carried out by Drs. RW Williams and Lu Lu at UTHSC. |
| Study Id: |
| 16 |


|
Web services initiated January, 1994 as Portable Dictionary of the Mouse Genome; June 15, 2001 as WebQTL; and Jan 5, 2005 as GeneNetwork. This site is currently operated by Rob Williams, Pjotr Prins, Zachary Sloan, Arthur Centeno. Design and code by Pjotr Prins, Zach Sloan, Arthur Centeno, Danny Arends, Christian Fischer, Sam Ockman, Lei Yan, Xiaodong Zhou, Christian Fernandez, Ning Liu, Rudi Alberts, Elissa Chesler, Sujoy Roy, Evan G. Williams, Alexander G. Williams, Kenneth Manly, Jintao Wang, and Robert W. Williams, colleagues. |

|

|
GeneNetwork support from:
|
|||
| It took 0.051 second(s) for tux01.uthsc.edu to generate this page | |||