|
What is GeneNetwork?

GeneNetwork is a group of linked data sets and tools used to study complex networks of genes, molecules, and higher order gene function and phenotypes. GeneNetwork combines more than 25 years of legacy data generated by hundreds of scientists together with sequence data (SNPs) and massive transcriptome data sets (expression genetic or eQTL data sets). The quantitative trait locus (QTL) mapping module that is built into GN is optimized for fast on-line analysis of traits that are controlled by combinations of gene variants and environmental factors. GeneNetwork can be used to study humans, mice (BXD, AXB, LXS, etc.), rats (HXB), Drosophila, and plant species (barley and Arabidopsis). Most of these population data sets are linked with dense genetic maps (genotypes) that can be used to locate the genetic modifiers that cause differences in expression and phenotypes, including disease susceptibility.
Users are welcome to enter their own private data directly into GeneNetwork to exploit the full range of analytic tools and to map modulators in a powerful environment. This combination of data and fast analytic functions enable users to study relations between sequence variants, molecular networks, and function.
What can I do with GeneNetwork?
QTL Mapping:
Interval Mapping: Statistical tests of association between trait values and the genotypes of marker loci through the genome. A significant association is interpreted as indicating the presence of a QTL linked to the marker that shows the association.
Simple interval mapping: This method evaluates the association between the trait values and the expected genotype of a hypothetical QTL (the target QTL) at multiple analysis points between each pair of adjacent
marker loci. The analysis point that yields the most significant associations may be taken as the location of a putative QTL. Bootstrap methods may be performed for estimating confidence intervals on QTL location.
Composite interval mapping: Like simple interval mapping, this method evaluates the possibility of a target QTL at multiple analysis points across each interlocus interval. However, at each point it also includes in the analysis the effect of one or more markers elsewhere in the genome. These markers, also called background markers, have previously been shown to be associated with the trait and therefore are each presumably close to another QTL (a background QTL).
Pair-scan: This method evaluates all marker pairs in two-locus models including main effects of each locus and their interaction. These allow discovery of multiple QTL models for complex phenotypes. For all mapping methods Permutation tests may also be selected to establish empirical significance thresholds.
Multiple Types of Correlation Analysis: Enables you to study the correlation between traits using a variety of methods including Pearson and Spearman correlations, partial correlations, literature correlations (based on Semantic Gene Organizer data), and tissue correlations. Trait values entered by users or retrieved from the databases can also be correlated "in bulk" against any other database of phenotype from the population of cases.
Correlation Matrix / Principal Components Analysis: Enables you to compare the values of up to 100 traits in a Trait Collection using correlation matrices. You can export correlations matrices and you can generate novel synthetic phenotypes by using the Principal Component derivatives of your group of traits..
QTL Heatmaps: Enables you to simultaneously map and analyze up to 100 traits using the QTL heatmap feature. The traits can be ordered by similarity of correlation (hierarchical clustering) or by their order in the genome. The QTL Heatmaps make is easy to identify common and unique genetic determinants of large sets of phenotypes.
Compare Correlates: Enables you to find shared genetic correlates among a group of traits by correlating them with all records from any database.
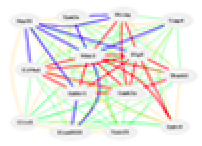
Network Graph: Enables you to examine the network of associations among large groups of phenotypes. Most graphs are interactive and allow users to define interesting trait sets which can be temporarily stored for further analysis in GeneNetwork.
Systems Genetics and Complex Trait Analysis:
GeneNetwork pages are extensively connected to external
resources. Numerous links to the UCSC and Ensembl Genome Browsers, PubMed, Entrez Gene, GNF Expression
Atlas, ABI Panther, and WebGestalt provide users with
rapid interpretive information about genomic regions, published phenotypes and
genes highlighted in WebQTL.
|


 menu_grp1