|
BLAT Specificity, Scores, and the Verify Location Button
BLAT Specificity provides a simple estimate of the quality of the alignment (specificity) of a group of probes on an array to a specific gene target. Values typically ranges from about 0.5 to 10, and higher values are better. Values less than 2 indicate that a probe sequence is not highly specific to one location in the genome. These probes may still be prefectly usable. Remember, you are interested in alignment to coding sequence (mRNA), but the BLAT function actually tests the entire genome, including regions that are almost never expressed. Specificity is computed as a simple ratio between the top (or correct) BLAT score to the second best (or incorrect) alignment. When the second BLAT score is low or null (no second-best alignment), then we declare a specificity value of 10 (great specificity). When the correct alignment is second best (this is not rare), then we declare the BLAT specificity to be 0.5. Values of 0.5 to 1.0 typically mean that probes have several possible matches across the whole genome. BLAT Score provide an estimate of the number of nucleotides that align well to one region of the genome. The maximum number can equal the length of the probe or probe set. For Affymetrix probe sets this number will usually be between 60 and 260. For Illumina and Agilent probes this number will typically be between 40 and 60. You can replicate the BLAT analysis by clicking on the Verify function button (one of the large square icons on Trait Data and Analysis page). This button triggers a new request to align the probe sequences to the most recent assembly of the genome using the UCSC Genome Browser Blat function. For example if you click on this button while viewing Affymetrix probe set 1421393_at, the following long and tedious command will be sent by GeneNetwork to the UCSC Genome Browser (this string of text is called a "get" command): http://genome.ucsc.edu/cgi-bin/hgBlat?org=mouse&db=mm8&type=0&sort=0&output=0&userSeq=%3E
A BLAT Search Results window will appear that lists the best matches of this sequence in the genome; in this case on mouse Chr 7 at 45.700822 Mb.
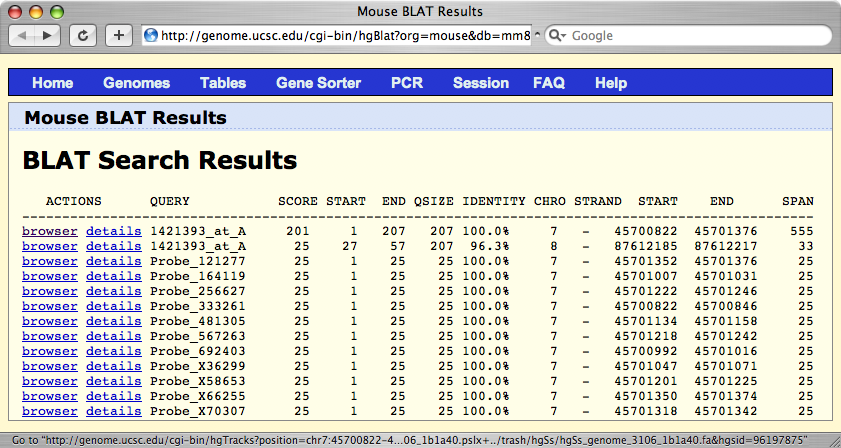
Legend: The first Verify output page from the Genome Browser lists the best genomic matches to the sequence of Affymetrix probe set 1421393_at. The best match has a score of 201 out of 207 nucleotides. One poor alignment (score of 25) is also given for the whole probe set to Chr 8 (an intron in Nfix. The individual probes are also listed and they have perfect scores, given their short length (25 of 25). To the far left of the BLAT Search Results page you will see links that are labeled browser. Click on the top line and you will see a small segment of the genome that matches the sequence on the array. Click on the 10x zoom out button in order to see a bit more of the chromosome and the genes in the local region.
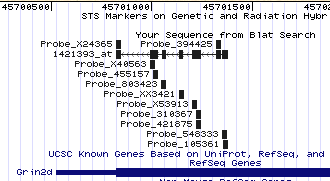
Legend: A typical Verify output page from the Genome Browser shows the alignment of Affymetrix probe set 1421393_at and its constituent set of eleven short (25 nucleotide) probes. The probe set is aligning to the negative strand (reading from right to left). The corresponding part of the Grin2d gene is shown in blue toward the bottom (the last exon and 3' untranslated region).
|
