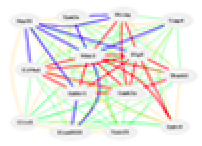
Data Set Group: EPFL/LISP BXD Liver Polar Metabolites CD+HFD (Dec13)

Data Set: EPFL/LISP BXD Liver Polar Metabolites HFD (Jun14)  |
| GN Accession: GN474 |
| GEO Series: |
| Title: Systems proteomics and trans-omic integration illuminate new mechanisms in mitochondrial function |
| Organism: Mouse (Mus musculus, mm10) |
| Group: BXD |
| Tissue: Liver Metabolome |
| Dataset Status: Public |
| Platforms: EPFL/LISP Polar Metabolites |
| Normalization: RPN |
|
| Contact Information |
Johan Auwerx
Ecole Polytechnique Federale de Lausanne
Bâtiment AI, Chambre 1351
Lausanne, Lausanne 1015 Switzerland
Tel. +41 216930951
admin.auwerx@epfl.ch
Website
|
| Download datasets and supplementary data files |
|
|
|
|
| Specifics of this Data Set: |
None
|
| Summary: |
| We identified 979 unique metabolite features based on mass-charge ratios (m/z) using flow-injection ToF-MS, respectively. Of these features, 699 could be attributed to a single metabolite, including in cases where of the two “possible” enantiomers, one is clearly far more predominant than the other (e.g. L versus D amino acids). The remaining 280 metabolites were “clusters” with no clear predominant feature—for example, the “glucose” metabolite measurements could not be separated from fructose, galactose, or mannose measurements, as all share the same m/z. The “main” metabolite, as well as all possible alternatives are listed with the data on GeneNetwork.org for the raw file download (press the “INFO” button next to the dataset on the main search page and download the dataset and supplemental data files).
|
| About the cases used to generate this set of data: |
| For liver metabolites, livers were perfused, frozen in liquid nitrogen, and then shattered in liquid nitrogen with a mortar and pestle at a later date. Several pieces of shattered liver totalling ~100 milligrams were collected then homogenized in 1mL 70% Ethanol at -20°C. Metabolites were extracted by adding 7mL 70% Ethanol at 75°C for 2 min. Extracts were centrifuged for 10 minutes at 4,000 rpm at 4°C. Clean metabolites extracts were dried in a vacuum centrifuge and re-suspended in double-distilled H2O with volume according to the weight of the extracted liver piece. Quantification of metabolites was performed on an Agilent 6550 QTOF instrument by flow injection analysis time-of-flight mass spectrometry (see: PMID 21830798). All samples were injected in duplicates. Ions were annotated based on their accurate mass and the Human Metabolome Database reference list (see: PMID 23161693) allowing a tolerance of 0.001 Da. Unknown ions and those annotated as adducts were discarded. Theoretical m/z ratios—beyond the significant digits from the measurement sensitivity—are used as the unique index in the online data on GeneNetwork. For example, deprotonated fumarate corresponds to 115.0036897_MZ, malate to 133.0142794_MZ, α-ketoglutarate to 145.0141831_MZ, and D2HG to 147.0298102_MZ.
|
| About the tissue used to generate this set of data: |
|
| About the array platform: |
|
| About data values and data processing: |
| GeneNetwork displays only the strain averages ± SEM for each metabolite. To obtain the individual data for each animal, please use the link above under (Download datasets and supplementary data files). Note that this contains two entries for each animal: these are technical replicates.
The very raw spectral data from the mass spectrometer can be downloaded on MassIVE ( http://massive.ucsd.edu/ProteoSAFe/static/massive.jsp?redirect=auth ) under the identifier MSV000079411. This spectral data is for all 290 individual animals, and it includes two technical replicates for each individual, for a total of 580 runs. The file size is 102 GB and we do not recommend downloading this unless you are specifically interested in re-analyzing the spectra from scratch and looking into the granular details of mass spectrometry metabolomics.
|
| Notes: |
|
| Experiment Type: |
|
| Contributor: |
|
| Citation: |
|
| Data source acknowledgment: |
|
| Study Id: |
179
|
|
|

|
Web services initiated January, 1994 as Portable Dictionary of the Mouse Genome; June 15, 2001 as WebQTL; and Jan 5, 2005 as GeneNetwork.
This site is currently operated by
Rob Williams,
Pjotr Prins,
Zachary Sloan,
Arthur Centeno. Design and code by Pjotr Prins, Zach Sloan, Arthur Centeno, Danny Arends, Christian Fischer, Sam Ockman, Lei Yan, Xiaodong Zhou, Christian Fernandez, Ning Liu, Rudi Alberts, Elissa Chesler, Sujoy Roy, Evan G. Williams, Alexander G. Williams, Kenneth Manly, Jintao Wang, and Robert W. Williams, colleagues.
|

|

|
GeneNetwork support from:
- The UT Center for Integrative and Translational Genomics
- NIGMS Systems Genetics and Precision Medicine project (R01 GM123489, 2017-2021)
- NIDA NIDA Core Center of Excellence in Transcriptomics, Systems Genetics,
and the Addictome (P30 DA044223, 2017-2022)
- NIA Translational Systems Genetics of Mitochondria, Metabolism, and Aging (R01AG043930, 2013-2018)
- NIAAA Integrative Neuroscience Initiative on Alcoholism (U01 AA016662, U01 AA013499, U24 AA013513, U01 AA014425, 2006-2017)
- NIDA, NIMH, and NIAAA (P20-DA 21131, 2001-2012)
- NCI MMHCC (U01CA105417), NCRR, BIRN, (U24 RR021760)
|
|
It took 0.103 second(s) for tux01.uthsc.edu to generate this page
|
|


 menu_grp1